Next: Correlation
Up: Correspondence Analysis
Previous: Correspondence Analysis
Intensity-based correspondence analysis
Intensity-based approaches compare intensity distributions between two images. Figure 2.12 shows two images and four intensity profiles.
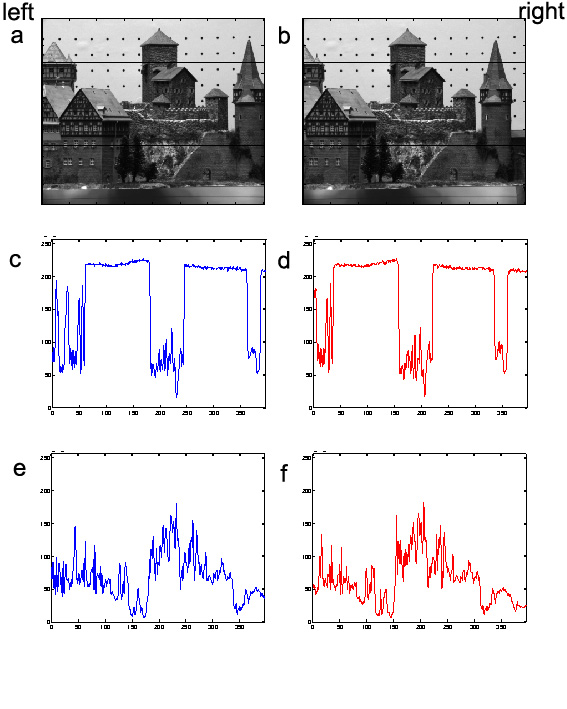 |
The distributions correspond to the black lines marked in the images. One at row 80 and the other at row 230. In fact, a close look at the intensity profiles from the corresponding rows of the image pair reveals that the two intensity profiles differ only by a horizontal shift and a local foreshortening. Figure 2.12a and Figure 2.12b depict the images taken with a camera that undergoes a displacement in the horizontal direction, the image pair therefore corresponds to a parallel camera set up. The same situation can be reached with any stereo system using rectification (see Section 2.3.3 for more information). The result of an intensity-based method is a dense disparity map ![]()
![]() , thus for every pixel its disparity is known. Unfortunately there are also occlusions in stereo images, for this parts of the image d(x) are undefined or set to a special value which represents an occluded area.
, thus for every pixel its disparity is known. Unfortunately there are also occlusions in stereo images, for this parts of the image d(x) are undefined or set to a special value which represents an occluded area.
There are several ways to find a solution for the corresponding problem. Two approaches will be mentioned: correlation and phase difference.
Next: Correlation
Up: Correspondence Analysis