Next: Phase Difference
Up: Intensity-based correspondence analysis
Previous: Intensity-based correspondence analysis
Correlation
Disparity ![]() , in this case, is the relative displacement between two grayscale distributions. For every pixel
, in this case, is the relative displacement between two grayscale distributions. For every pixel ![]() in the left image, a window with size
in the left image, a window with size ![]() centered at the actual pixel is compared with a window which is centered at pixels
centered at the actual pixel is compared with a window which is centered at pixels
![]() along the epipolar line. Figure 2.19 shows the shift of the window in the right image in case of a standard geometry. In this case
along the epipolar line. Figure 2.19 shows the shift of the window in the right image in case of a standard geometry. In this case
![]() .
.
The similarity with the highest correlation is chosen. The correlation is defined as
 | (2.22) |
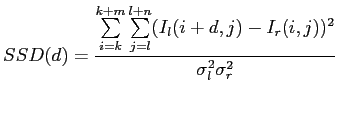
Because correlation takes a lot of time to compute, the sum of squared difference (SSD) is often used instead. Equation 2.23 shows the equation of SSD.
 | (2.24) |
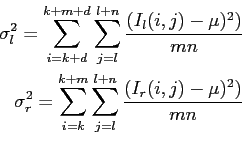
Intensity differences in high contrast areas are more reliable than in low contrast areas. A possible solution is to normalize Equation 2.23 with the local variance.
Another problem is that cameras often have different sensitivities. A solution for this problem is to normalize the image with variance and intensity. Equation 2.25 would look like
So far we assumed that we have a fixed window size ![]() (m
(m![]() n). The choice of
n). The choice of ![]() influences the resulting disparity map. If
influences the resulting disparity map. If ![]() is very small, many false matches can occur, especially if the images are noisy. If
is very small, many false matches can occur, especially if the images are noisy. If ![]() is very big, then the optimum is flattened and the computation time increases. Some approaches use adaptive window sizes to gain their results [KO94]. After calculating disparity values for all pixels, the resulting disparity map should be convolved with a median filter so that single very unrepresentative pixel in a neighbour hood are deleted.
is very big, then the optimum is flattened and the computation time increases. Some approaches use adaptive window sizes to gain their results [KO94]. After calculating disparity values for all pixels, the resulting disparity map should be convolved with a median filter so that single very unrepresentative pixel in a neighbour hood are deleted.
Next: Phase Difference
Up: Intensity-based correspondence analysis


![$displaystyle SSD(d) = sum limits_{i=k}^{k+m} sum limits_{j=l}^{l+n} big[ ...
..._l(i+d,j) -mu_l)}{sigma_l^2} - frac{(I_r(i,j)^2 - mu_r)}{sigma_r^2}big]^2$](https://www.anagram.at/app/uploads/2014/02/img142.png)