Next: Feature-based Correspondence Analysis
Up: Intensity-based correspondence analysis
Previous: Correlation
Phase Difference
Another property to match is local frequency components [San88,FJJ91]. If a function ![]()
![]() with fourier transform
with fourier transform ![]() is shifted by an amount of
is shifted by an amount of ![]() then the resulting fourier transform of the shifted function
then the resulting fourier transform of the shifted function ![]() is
is
![]()
![]() . The shift in the spatial domain is equivalent to a phase shift in the frequency domain. It is possible to determine the disparity if the phase differences are found. Since the shift in the spatial domain is not equal for different regions of the image, for example the disparity differs for different objects that are mapped onto the image plane, a local frequency filter is needed to determine the phase differences. The Gabor filter [Gab46], which is a bandpass filter with limited bandwidth, can be used for this. Equation 2.27 shows the filter
. The shift in the spatial domain is equivalent to a phase shift in the frequency domain. It is possible to determine the disparity if the phase differences are found. Since the shift in the spatial domain is not equal for different regions of the image, for example the disparity differs for different objects that are mapped onto the image plane, a local frequency filter is needed to determine the phase differences. The Gabor filter [Gab46], which is a bandpass filter with limited bandwidth, can be used for this. Equation 2.27 shows the filter
 | (2.28) |
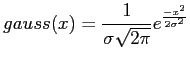
![]()
![]() is the filter width and
is the filter width and ![]() is the filter frequency for solving the correspondence problem. The product
is the filter frequency for solving the correspondence problem. The product
![]()
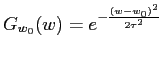
![]() is one, which is the theoretical minimum of any linear complex filter [Gab46]. Convolving
is one, which is the theoretical minimum of any linear complex filter [Gab46]. Convolving ![]()
![]() with the image intensities
with the image intensities ![]() yields a joint spatial and frequency representation of an image [Dau85]:
yields a joint spatial and frequency representation of an image [Dau85]:
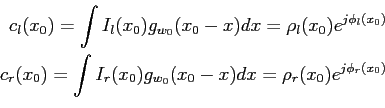 |
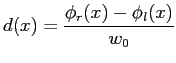
As said before, a shift in the spatial domain is represented as a phase shift in the frequency domain, this gives an already estimation of the disparity ![]()
![]() .
.
| (2.31) |
 | (2.32) |
Advantages of the phase difference method are that it is not that sensitive to noise and that the correspondence analysis works with subpixel accuracy.
Next: Feature-based Correspondence Analysis
Up: Intensity-based correspondence analysis